【Python】 matplotlibの使用例
matplotlibの使用例をメモしておきます。月別の東京の平均気温を表示する例を示しています。平均気温を棒グラフや散布図を使って表すことは無いと思いますが、あくまでも使い方に焦点を当てているためご容赦下さい。
折れ線グラフ
import numpy as np
from matplotlib import pyplot as plt

if __name__ == '__main__':
    # 月
    months = [1, 2, 3, 4, 5, 6, 7, 8, 9, 10, 11, 12]
    # 平均気温
    temperatures = [6.1, 7.2, 10.1, 15.4, 20.2, 22.4,
                    25.4, 27.1, 24.4, 18.7, 11.4, 8.9]

    # 折れ線グラフを作成する
    plt.plot(months, temperatures, color='orange', marker='o')
    # グラフのタイトル
    plt.title("Tokyo average temperatures on 2016")
    # 軸ラベル
    plt.xlabel("Month")
    plt.ylabel("Temperature")
    # 罫線を表示する
    plt.grid()
    # グラフを表示する
    plt.show()

棒グラフ
import numpy as np
from matplotlib import pyplot as plt

if __name__ == '__main__':
    # 月
    months = [1, 2, 3, 4, 5, 6, 7, 8, 9, 10, 11, 12]
    # 平均気温
    temperatures = [6.1, 7.2, 10.1, 15.4, 20.2, 22.4,
                    25.4, 27.1, 24.4, 18.7, 11.4, 8.9]

    # 棒の幅が0.8なので、0.4のオフセットを加えて棒をセンタリングさせる
    xs = [m - 0.4 for _, m in enumerate(months)]
    # 棒グラフを作成する
    plt.bar(xs, temperatures)
    # グラフのタイトル
    plt.title("Tokyo average temperatures on 2016")
    # 軸ラベル
    plt.xlabel("Month")
    plt.ylabel("Temperature")
    # 罫線を表示する
    plt.grid()
    # グラフを表示する
    plt.show()

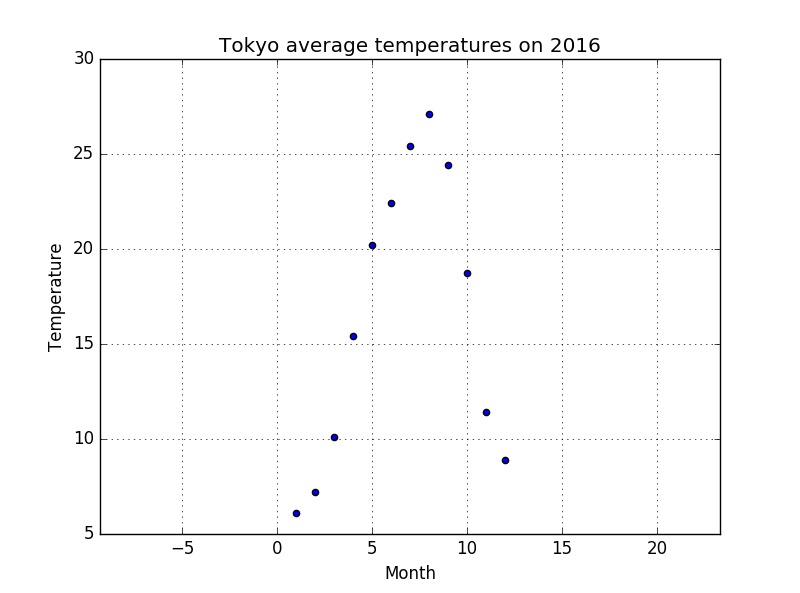
散布図
import numpy as np
from matplotlib import pyplot as plt

if __name__ == '__main__':
    # 月
    months = [1, 2, 3, 4, 5, 6, 7, 8, 9, 10, 11, 12]
    # 平均気温
    temperatures = [6.1, 7.2, 10.1, 15.4, 20.2, 22.4,
                    25.4, 27.1, 24.4, 18.7, 11.4, 8.9]

    # 散布図を作成する
    plt.scatter(months, temperatures)
    # グラフのタイトル
    plt.title("Tokyo average temperatures on 2016")
    # 軸ラベル
    plt.xlabel("Month")
    plt.ylabel("Temperature")
    # 罫線を表示する
    plt.grid()
    # 軸の縦横比を等しくする
    plt.axis('equal')
    # グラフを表示する
    plt.show()
